Getting the Latest Record per Group Without Loading the Whole History
Introduction
If you've worked on a SaaS application that connects to third-party services, you probably know how quickly a simple integration can become complicated. You start by calling an API, then you add authentication, retries, rate limits, pagination, and a little more error handling than you originally expected.
Eventually, someone wants a dashboard. Nothing fancy. Just a list of connected services, the status of their last synchronization, and when it happened.
The requirement sounds harmless: give me the latest synchronization run for every integration.
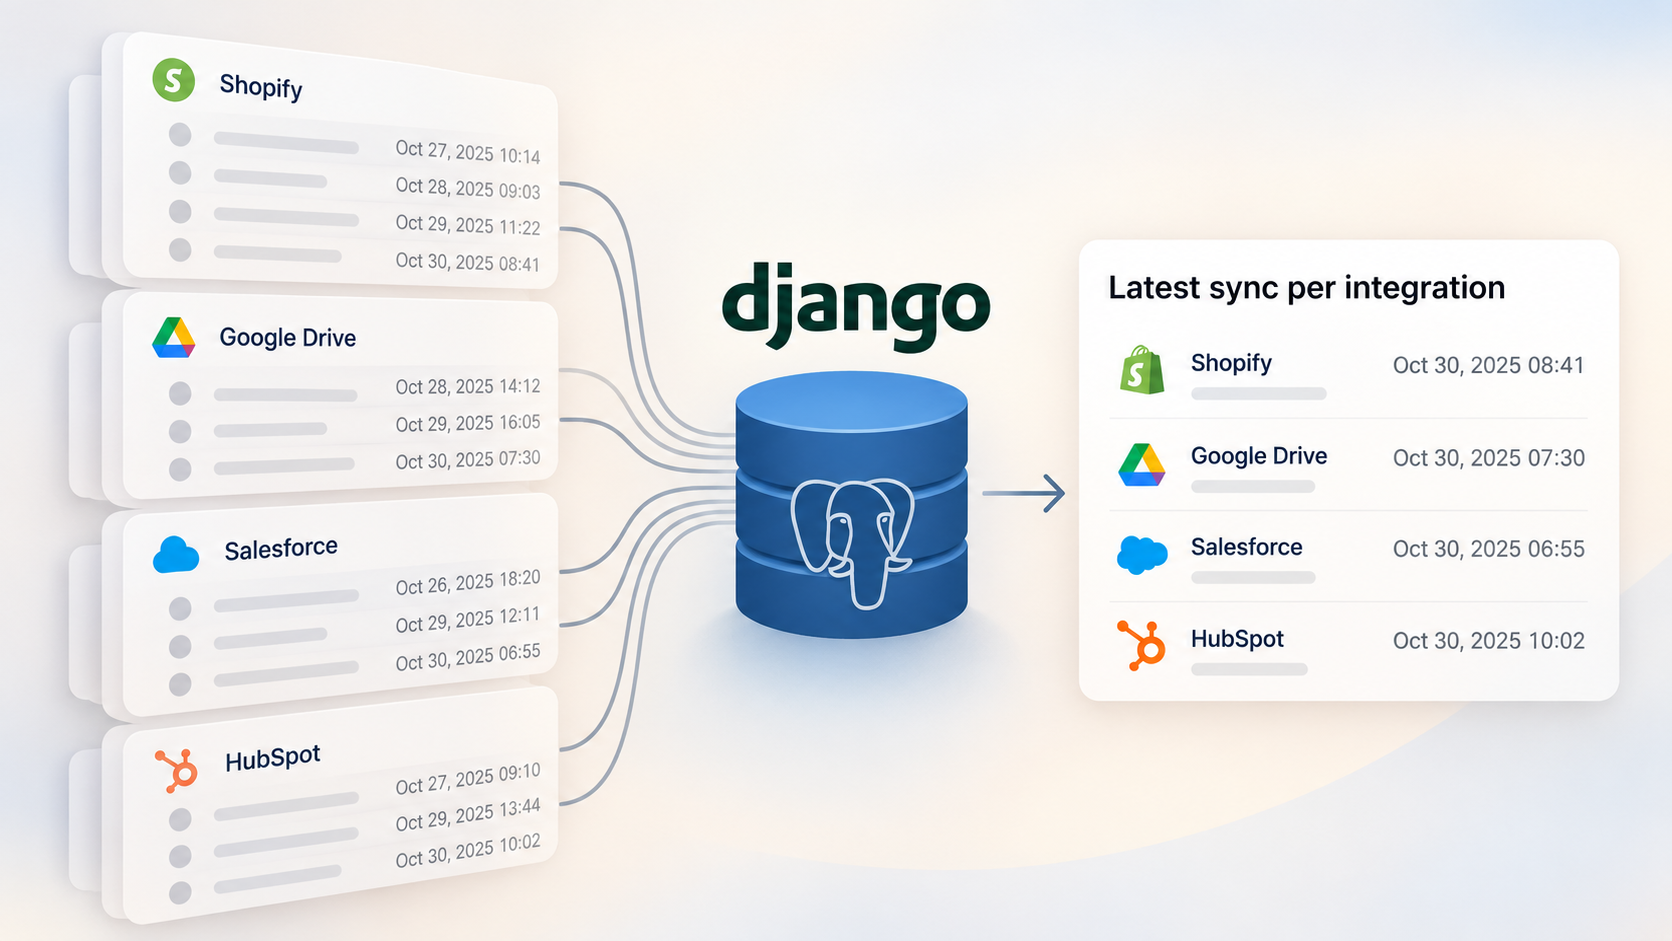
It's also the kind of requirement where we can end up moving far more data than we need. A workspace might have hundreds of integrations. Each one might have years of synchronization history. The dashboard needs one record from each history, not the entire history.
In Django, it's tempting to solve this with a loop over the integrations or to prefetch all their related runs. Both are easy to read. Neither tells us much about the amount of work happening between the database and Python.
I wanted to look at the problem from the data side first. Instead of comparing ORM snippets I haven't actually run, I built a small experiment with four implemented and measured SQL/Python approaches. The goal isn't to crown a universal winner. It's to understand where the rows are being filtered and what that decision costs.
A small but realistic dataset
Imagine a multi-tenant integration platform with three main concepts:
- A workspace owns several integrations.
- An integration connects that workspace to an external provider.
- A synchronization run records the status and start time of a single import.
For the experiment, I created 840 integrations in one workspace. 800 have 100 runs each; the other 40 have never synchronized. That gives us 80,000 synchronization runs and, at most, 800 latest-run results.
The test uses the following simplified schema. This is the schema created by the accompanying benchmark, not a proposed Django migration:
CREATE TABLE integration (
    id INTEGER PRIMARY KEY,
    workspace_id INTEGER NOT NULL
);

CREATE TABLE sync_run (
    id INTEGER PRIMARY KEY,
    integration_id INTEGER NOT NULL,
    started_at INTEGER NOT NULL,
    status TEXT NOT NULL
);

CREATE INDEX ix_latest
    ON sync_run (integration_id, started_at DESC, id DESC);
Before we start, we need to define latest. I use the greatest started_at value for each integration. If two runs have the same timestamp, the greater id wins. I deliberately created timestamp ties in the test data; otherwise, two methods could appear to agree simply because the ambiguous case never occurred.
That last detail is easy to overlook. MAX(started_at) gives us a date, but it doesn't necessarily identify one record. The dashboard needs the record, including its status, and it needs a consistent answer.
The other rule is just as important: all queries are restricted to the workspace we're examining. In a real SaaS application, the workspace ID must also be authorized before executing the query. Filtering by a tenant ID is not, on its own, an authorization check.
1. Fetch everything, decide in Python
The first approach is straightforward: get the synchronization runs and choose the latest one for each integration in Python.
This is the exact SQL used by the benchmark:
SELECT r.id, r.integration_id, r.started_at, r.status
FROM sync_run AS r
JOIN integration AS i ON i.id = r.integration_id
WHERE i.workspace_id = 1;
Once the rows are fetched, the test groups them by integration and chooses the winner using (started_at, id) as the ordering key:
runs_by_integration = defaultdict(list)
for row in rows:
    runs_by_integration[row[1]].append(row)

latest_rows = [
    max(runs, key=lambda run: (run[2], run[0]))
    for runs in runs_by_integration.values()
]
It works, and the benchmark verifies that the IDs match the other approaches. But it has an obvious cost: all 80,000 rows cross into Python, even though we ultimately retain 800.
That's the first lesson. A query count of one isn't particularly impressive if that query returns a hundred times more data than we need.
2. Let SQL sort, then take the first row
What if we let the database sort the runs before Python sees them?
SELECT r.id, r.integration_id, r.started_at, r.status
FROM sync_run AS r
JOIN integration AS i ON i.id = r.integration_id
WHERE i.workspace_id = 1
ORDER BY r.integration_id, r.started_at DESC, r.id DESC;
Now all runs from the same integration are adjacent, with the newest first. The Python side simply keeps the first row it encounters for each integration_id.
That makes the selection logic easier, but it doesn't solve the underlying problem. We're still fetching 80,000 rows. We've moved some work to the database, not reduced the result set.
In our measurements, this version wasn't faster than the Python max() approach. That doesn't mean sorting in SQL is generally slower; it means doing so wasn't enough to make this fetch-everything strategy efficient.
3. ROW_NUMBER(): filter before the rows reach Python
This is where the query starts matching the actual requirement.
Instead of returning every synchronization run and asking Python which one is newest, we can number the runs inside each integration and keep only number one.
SELECT id, integration_id, started_at, status
FROM (
    SELECT r.id, r.integration_id, r.started_at, r.status,
           ROW_NUMBER() OVER (
               PARTITION BY r.integration_id
               ORDER BY r.started_at DESC, r.id DESC
           ) AS row_number
    FROM sync_run AS r
    JOIN integration AS i ON i.id = r.integration_id
    WHERE i.workspace_id = 1
) AS ranked
WHERE row_number = 1;
PARTITION BY integration_id creates an independent ranking for each integration. The ordering inside the window resolves timestamp ties. The outer filter returns only the winner.
Now SQLite returns 800 rows, not 80,000. The Python allocation figure drops sharply, because there is much less data to materialize.
There is a trade-off. The database has to rank the rows before it can discard the older ones. In this experiment, that still took noticeably longer than the next approach.
I like the window-function pattern because the intent is clear. It's also naturally suited to a slightly different requirement, such as the three latest runs per integration. But I haven't benchmarked that variation here, so I'm not treating it as a measured result.
4. Start with the integrations, find one run for each
The final approach reverses the direction of the search.
Rather than read the entire run history and find the first record in each group, we start with the 800 integrations that have runs, plus the 40 empty ones, and ask for the latest run ID belonging to each of them.
Here is the actual query:
SELECT r.id, r.integration_id, r.started_at, r.status
FROM sync_run AS r
WHERE r.id IN (
    SELECT (
        SELECT sr.id
        FROM sync_run AS sr
        WHERE sr.integration_id = i.id
        ORDER BY sr.started_at DESC, sr.id DESC
        LIMIT 1
    )
    FROM integration AS i
    WHERE i.workspace_id = 1
);
The inner lookup finds one ID per integration. Integrations without runs produce no matching run, and the outer query retrieves the complete records for the IDs we found.
At first, a correlated subquery can look more complicated than a window function. But notice the access pattern: one ordered lookup per integration, with the index matching both the group key and the order we're asking for.
For this dataset, SQLite used the index in the lookup. The relevant part of EXPLAIN QUERY PLAN was:
SEARCH r USING INTEGER PRIMARY KEY (rowid=?)
LIST SUBQUERY 2
SCAN i
CORRELATED SCALAR SUBQUERY 1
SEARCH sr USING COVERING INDEX ix_latest (integration_id=?)
The last line is interesting. SQLite can use ix_latest when looking for each integration's latest run, rather than scanning the entire synchronization history for every parent.
The benchmark: time, memory, and transferred rows
Here are the results of a local run of the companion benchmark. It uses Python 3.13.5 and SQLite 3.46.1, an in-memory database, and the composite index shown above.
Each approach gets a warm-up execution followed by five timed runs. I report the median wall-clock time. tracemalloc runs in a separate pass to measure peak Python allocations without affecting the timed samples. Every implementation is checked against the same list of latest-run IDs, including our deliberate timestamp ties.
| Implemented approach | Median time | Peak Python allocations | SQL rows fetched |
|---|---|---|---|
All rows + Python max() | 62.52 ms | 17.10 MiB | 80,000 |
| All rows sorted + Python first | 78.13 ms | 16.39 MiB | 80,000 |
ROW_NUMBER() | 79.21 ms | 0.17 MiB | 800 |
| Correlated subquery | 1.95 ms | 0.17 MiB | 800 |
These are results from the SQLite/Python benchmark, not Django or PostgreSQL timings. tracemalloc does not measure SQLite's internal memory or total process RSS. Wall-clock measurements will vary by machine.
The most useful result here isn't the exact number of milliseconds. It's the difference between processing an entire history in Python and returning only what the application needs.
The correlated subquery was dramatically faster on this particular SQLite dataset. That could change with a different distribution of runs, missing or different indexes, or a different database engine. I wouldn't use these numbers to declare a PostgreSQL winner.
What does this mean for a Django application?
The original problem is a Django backend problem, but these measurements are deliberately below the ORM layer. I have not timed Django model construction, prefetch_related(), or PostgreSQL's query planner, so I am not attaching measured performance claims to those features.
Still, the experiment gives me a useful way to review a query before I optimize it. I want to know how many rows reach Python, whether I can decide the winning record in SQL, whether the ordering handles ties, and whether the index matches the lookup I'm actually performing.
I would also think about the shape of the endpoint. A dashboard that must show integrations with no synchronization history is different from a report containing only the latest runs. Our four measured queries return run records; none of them returns a placeholder row for an empty integration. If the UI needs those integrations, the final application query or response construction must account for them.
And before moving any approach into production, I'd benchmark the actual Django/PostgreSQL query with realistic tenant sizes. The figures above are a controlled experiment, not a substitute for that check.
Conclusion
I started with a familiar requirement: one latest synchronization run for each integration. Four implementations later, the biggest difference wasn't the number of SQL statements. Each approach used one query. The difference was where we selected the 800 rows that mattered.
Fetching every run and narrowing the list in Python is easy to write, but it means transferring and allocating the whole history. Window functions reduce the rows returned to the application. And, with the index and data distribution used in this test, a parent-driven subquery found the winners without examining the whole result in Python.
There's no reason to complicate a query before we need to. But when an endpoint starts dragging through years of historical records to show one status per integration, I'd look at the data access pattern before trying to optimize the Python loop.
The database already has the data. The interesting part is asking it for exactly the data we need.